The Imaging Plugin in BeeGraphy allows you to work with images as data, not just visuals. Instead of treating images as static pictures, this plugin lets you extract information from images such as color, brightness, position, and edges and use that information to drive geometry, patterns, and logic in your node graph.
The Imaging Plugin is commonly used to create image-driven patterns and layouts, where visual information directly controls how geometry is placed and structured. It enables users to convert images into point clouds or contours, making it possible to translate visual shapes and features into parametric geometry. By analyzing brightness and contrast, image data can be used to drive parameters such as density, size, or variation, allowing designs to respond intelligently to visual intensity. The plugin also supports mapping image data onto geometry or surfaces, which is especially useful in texture-based or surface-driven workflows. Altogether, this makes the Imaging Plugin a strong tool for experimental and generative design, where images act as active inputs rather than static references.
What makes the Imaging Plugin particularly powerful is its ability to bridge visual media and parametric logic within a single environment. It removes the need for external image-processing software by keeping all image analysis inside the node graph, ensuring a smooth and connected workflow.
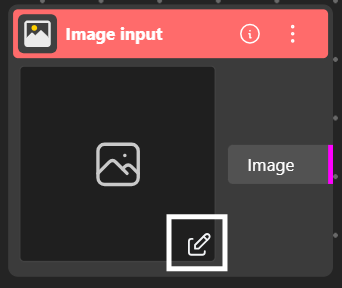
Image Input allows you to load image files directly into the node. Supported formats include PNG, JPG, JPEG, and WEBP.
To add an image, click the Edit icon on the node.
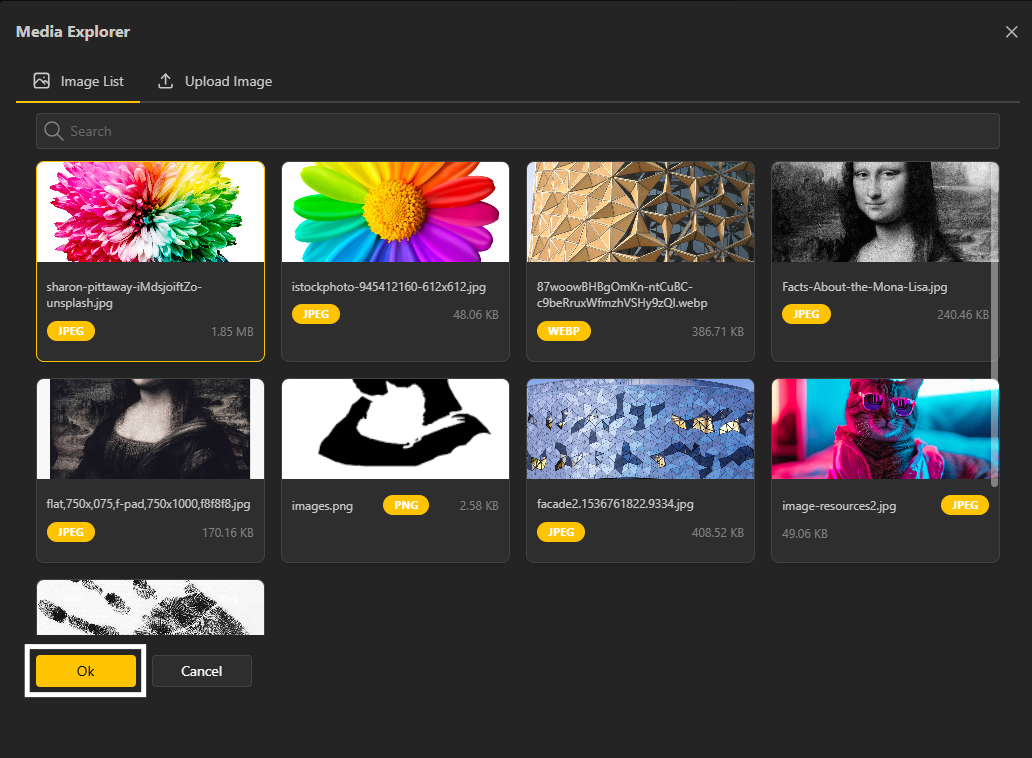
A dialog box will open.
Select your desired image and click OK to confirm.
The Image Sampler reads an image and extracts data from it at regular intervals. It samples pixel positions and retrieves information such as color values and intensity. This data can then be used to drive geometry, patterns, or logic based on the image content. It is commonly used when you want image pixels to control parametric designs.
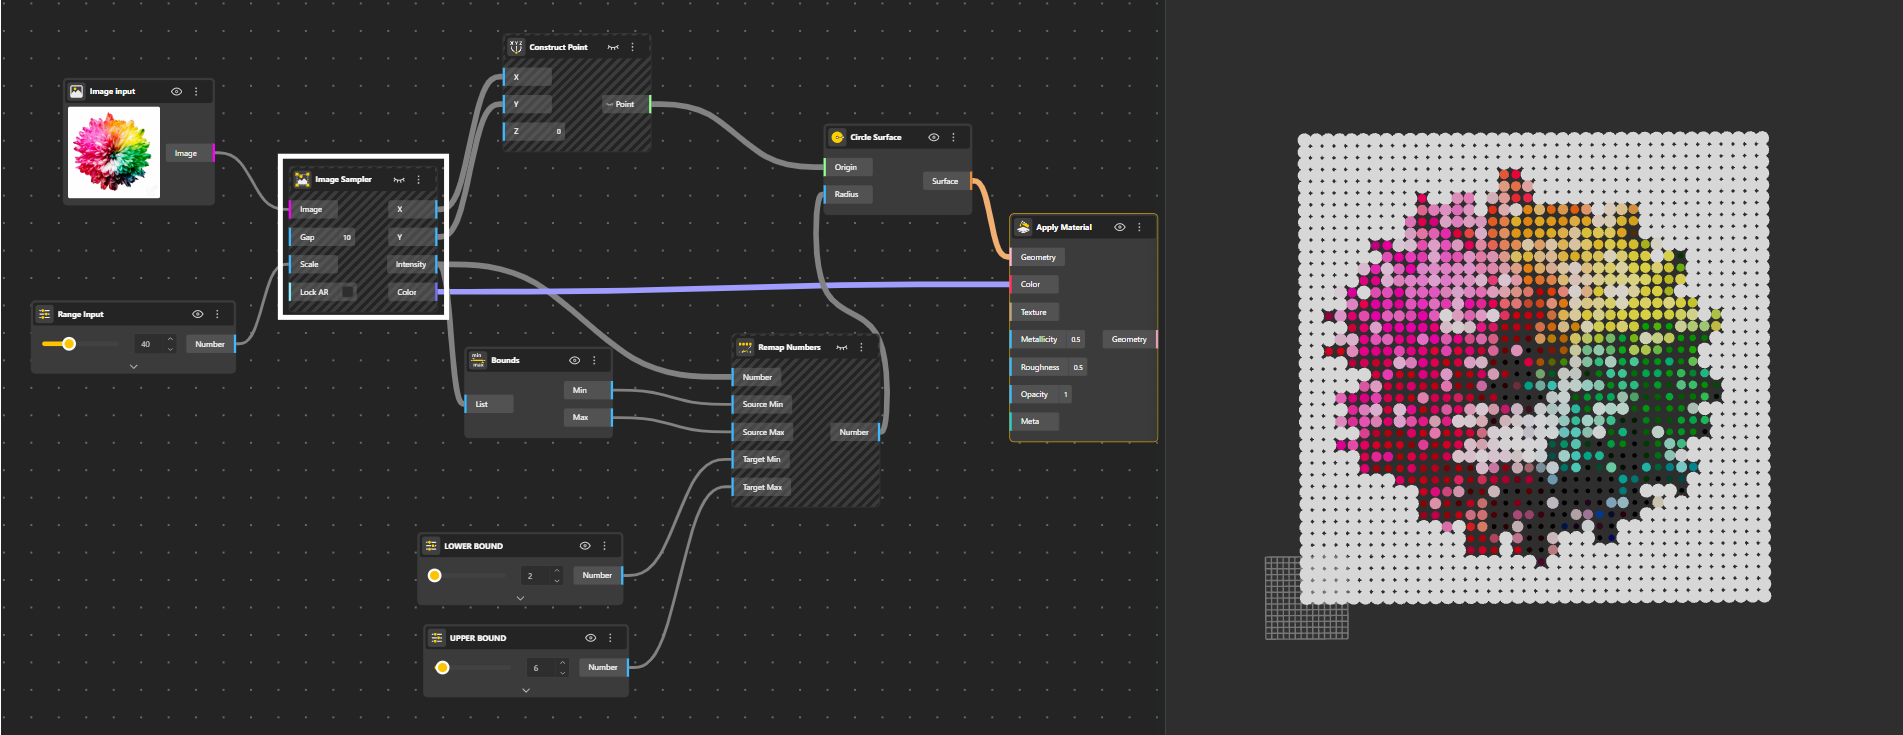


Check out the Image Sampler model. Duplicate it to explore and experiment.
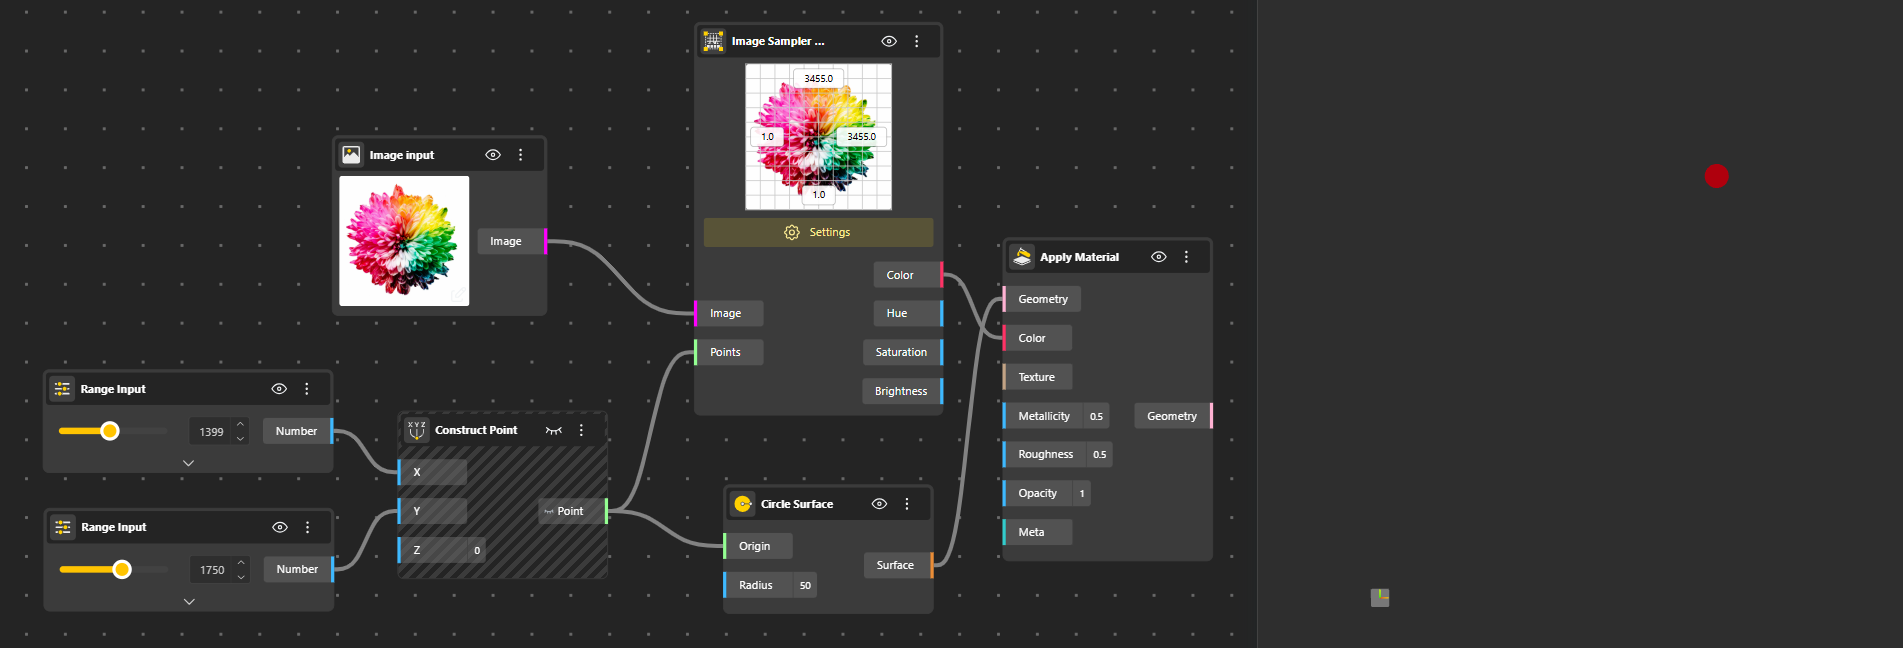
The Image Sampler UV node samples an image at specific UV coordinates, not on a fixed grid like the regular Image Sampler, but at any custom points you supply. These points are in UV space, where:
U (x) goes from left to right.
V (y) goes from bottom to top of the image.
Give the node a list of UV points (x, y) (for example a grid, curve, or single point), and it returns:
Color — the exact sampled color at each point (as hex),
Hue — color hue (0 – 1),
Saturation — color saturation,
Brightness — brightness/value.
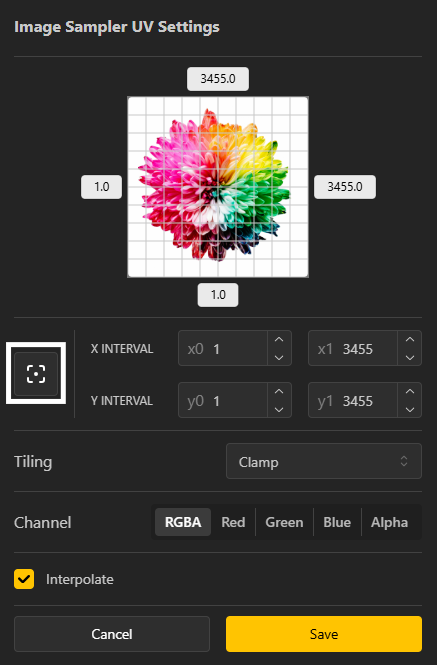
Channel: The Channel option lets you choose which data is sampled from the image.
RGBA samples the full color information.
Red, Green, Blue isolate individual color channels for data-driven workflows.
Alpha reads transparency values, commonly used for masking or intensity control.
Preview / Aspect-Ratio Icon: The small preview-like icon preserves the original aspect ratio of the image. When enabled, the UV grid automatically matches the image’s true proportions, ensuring the sampling grid aligns correctly without distortion.
Manual Ratio Control (X & Y Intervals): To define the sampling region manually, use X Interval and Y Interval values.
Start (x0 / y0) and End (x1 / y1) points define the UV range.
This allows custom cropping, scaling, or remapping of the image over the UV grid.
Tiling Modes: Tiling controls how the image behaves when UVs extend beyond the defined range:
Clamp – Repeats the edge pixels, stretching the border outward. Best for avoiding seams.
Flip – Mirrors the image at each boundary, creating a back-and-forth pattern.
Tile – Repeats the image continuously in all directions for seamless patterns.
Together, these settings give precise control over how image data is sampled, mapped, and reused within parametric definitions.
Check out the file here to better understand how it works. Duplicate the script and experiment with it to explore the behavior on your own.
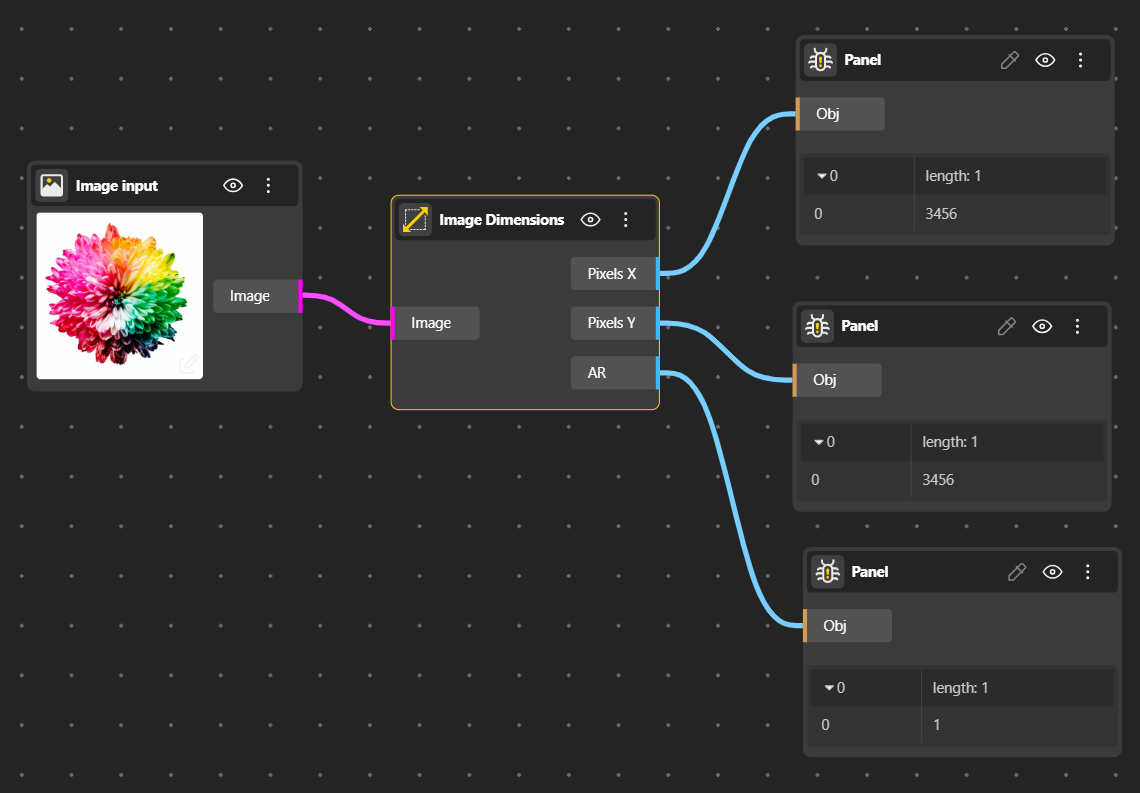
The Image Dimensions node outputs basic properties of an image. It provides the width, height, and aspect ratio, allowing you to scale or align geometry correctly. This node is especially important when maintaining proportions in image-driven workflows. It helps avoid distortion when mapping images to geometry.

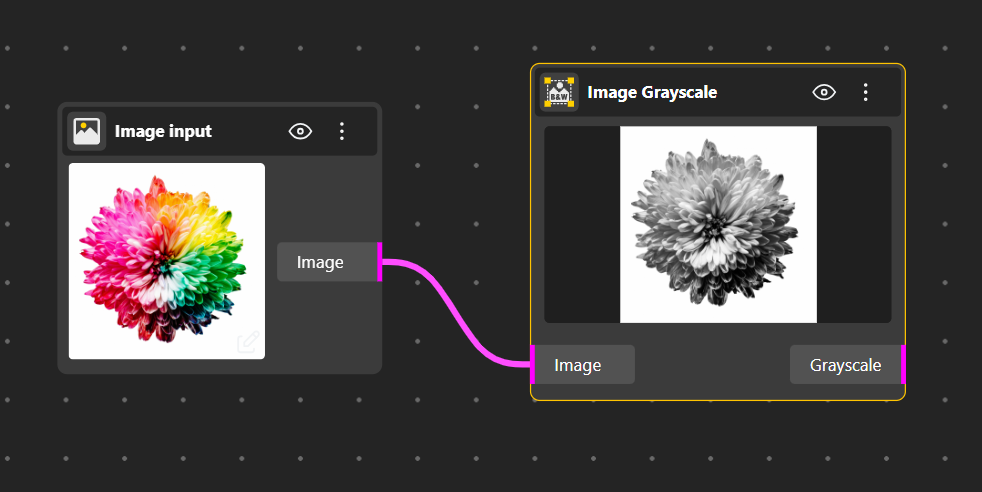
The Image Grayscale node converts a color image into a grayscale image. All color information is reduced to brightness values, simplifying the image data. This is often used before analysis tasks like edge detection or intensity-based sampling. It helps focus only on light–dark variations rather than color.

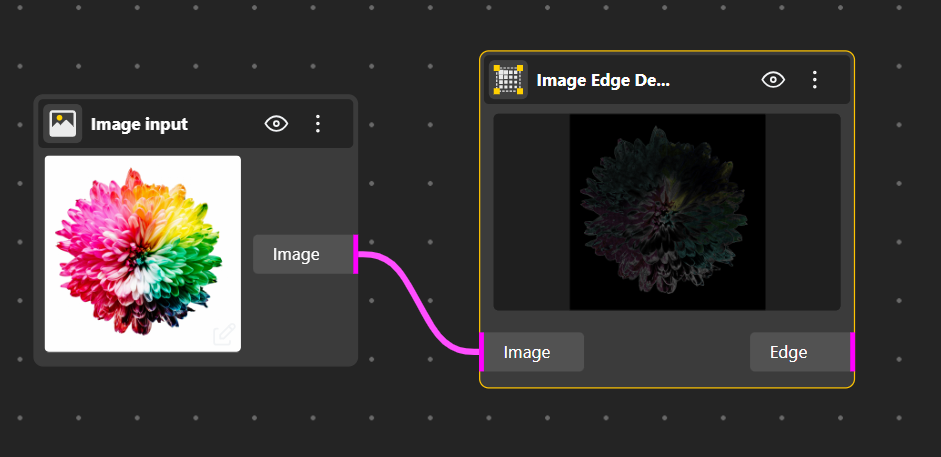
The Image Edge Detection node identifies edges, outlines, and boundaries by detecting contrast transitions. This is useful for extracting shapes, contours, or structural patterns from images. Often used in image-to-geometry or analytical workflows.
The Image Preview node displays the image directly inside the editor. It helps users visually verify which image is being processed at any stage. This node is mainly for reference and debugging, not for data extraction. It ensures clarity when working with multiple image transformations.