The Dimensions Package adds dimensioning tools to the BeeGraphy Editor, allowing you to measure and visually annotate geometry directly inside the viewport.
It is designed for design validation, documentation, and presentation, providing clean dimension graphics with arrows, labels, and customizable styles.
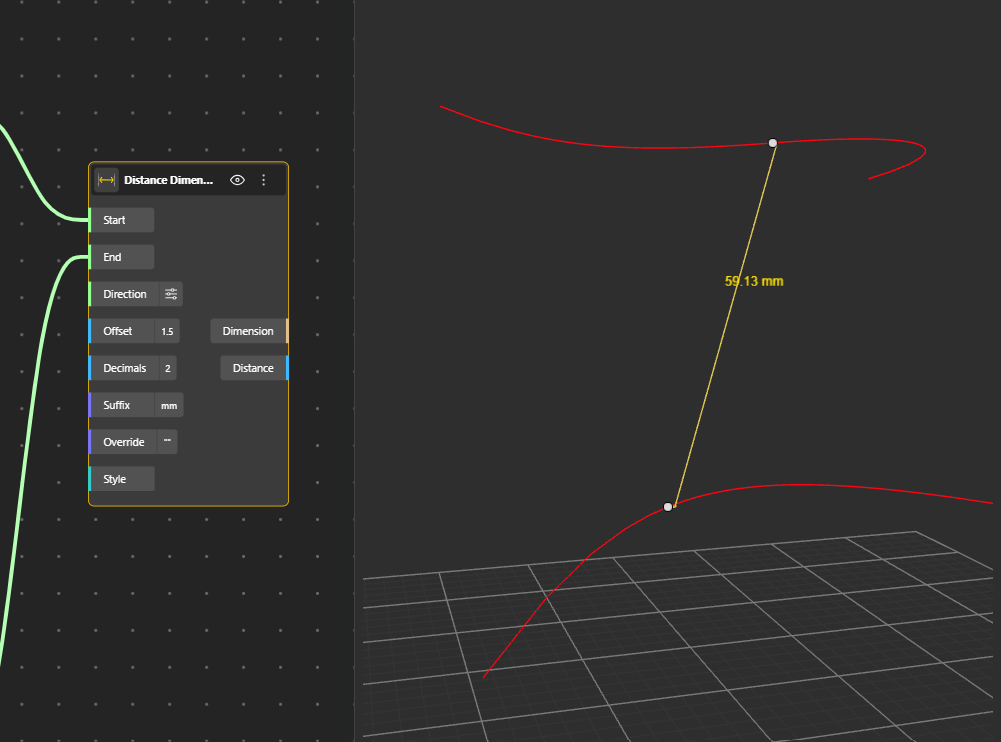
The Distance Dimension node measures the straight-line distance between two 3D points and renders a line with optional arrowheads with numeric distance value labelled. Users can control the offset of the label, the number of decimal places shown, and the unit suffix. If no direction is provided, the node automatically computes a perpendicular direction to place the dimension clearly in space.

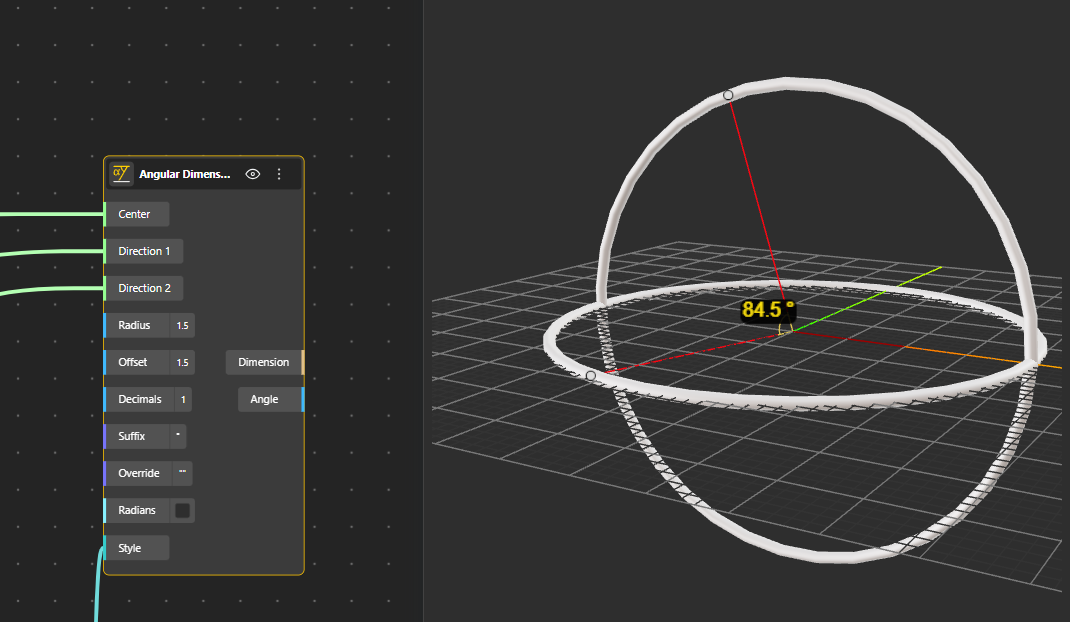
The Angular Dimension node visualizes the angle formed by two directions around a center point. It draws an arc between the directions, adds arrowheads at the arc ends, and places a text label showing the measured angle. The radius of the arc, label offset, unit format (degrees or radians), precision, and labeling can all be customized, making it suitable for clearly communicating rotational relationships in both conceptual and technical models.

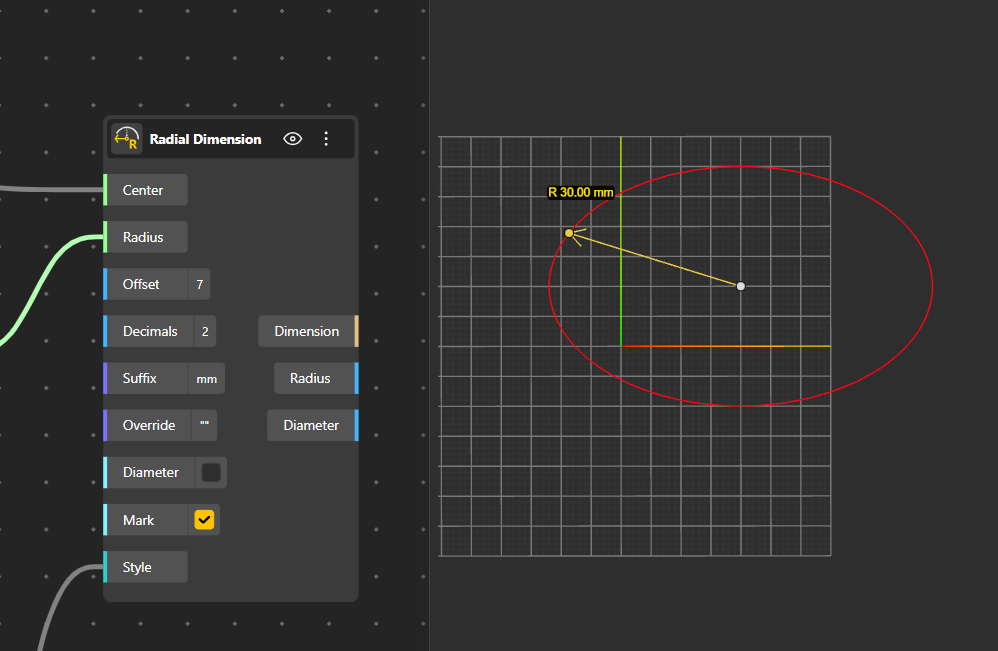
For circular measurements, the Radial Dimension node measures the radius from a center point to a point on the circumference and displays the result using a leader line and arrowhead. It can optionally show the diameter instead of the radius and include a center mark for clarity. The node outputs both radius and diameter numerically, allowing the same measurement to be reused in parametric logic or validation workflows.

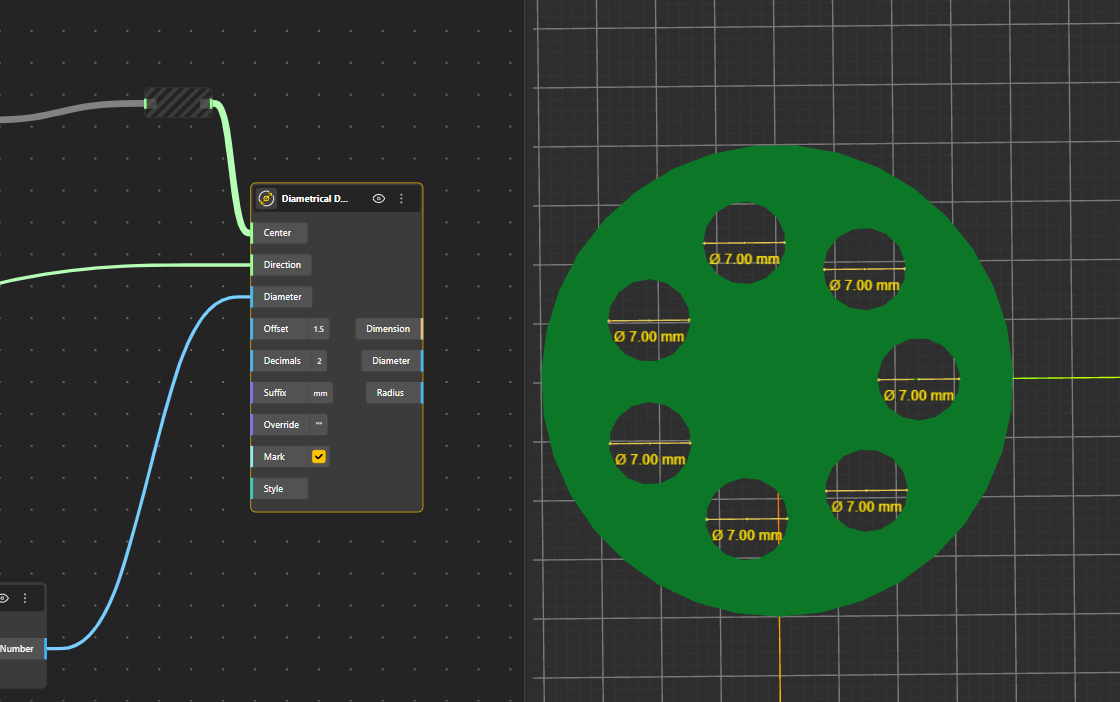
The Diametrical Dimension node directly visualizes a diameter using a given direction from the center point. It draws a diameter line across the circle, optionally includes arrowheads, and can display a center mark. This node is useful when a diameter value is already known or controlled parametrically, while still needing to be clearly annotated in the viewport. Both diameter and radius values are made available as outputs.

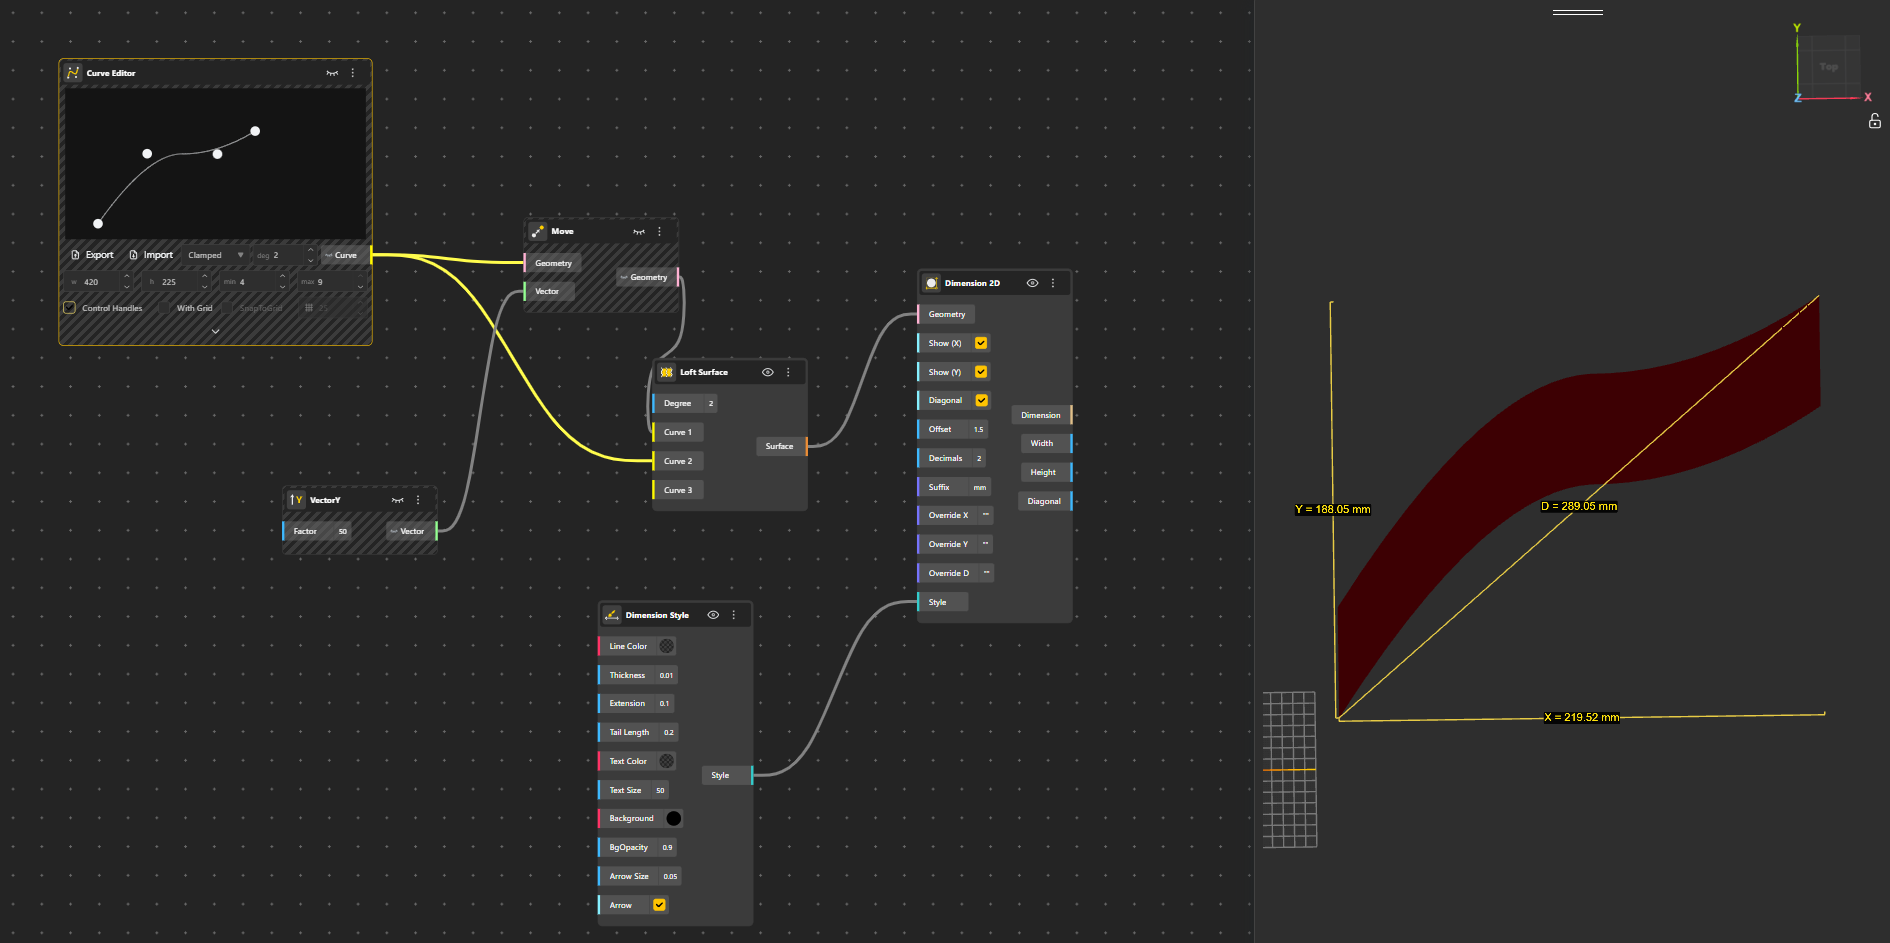
For measuring overall size, the Dimension 2D node computes the two-dimensional bounding box of a geometry and visualizes its width and height, with an optional diagonal dimension. Labels for each axis can be overridden individually, and the node outputs the minimum and maximum bounding points in addition to the measured values. This makes it especially useful for layouts, panels, and planar components.

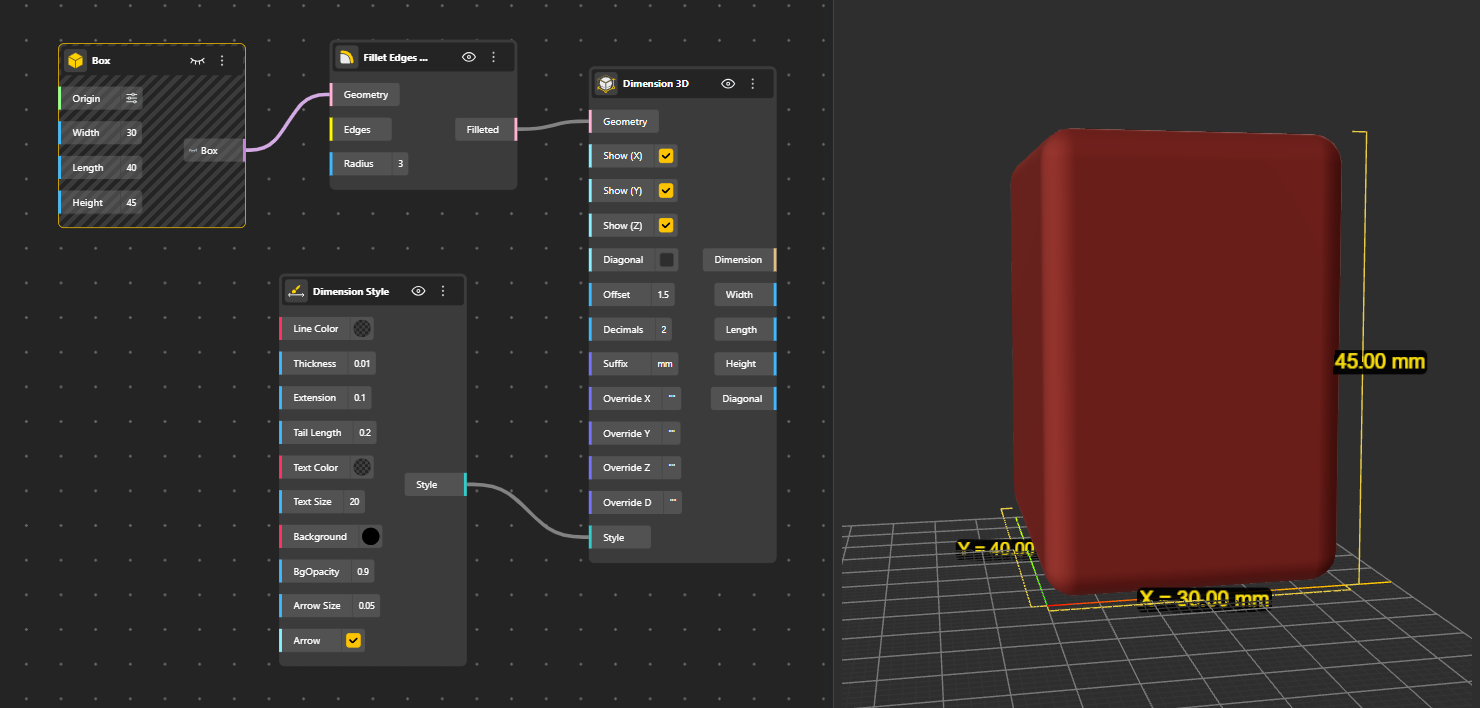
The Dimension 3D node extends this concept to three dimensions, calculating the bounding box of geometry in space and displaying width, length, and height, with the option to show the diagonal as well. Like its 2D counterpart, it outputs all measured values numerically while rendering clean dimension graphics in the viewport, making it suitable for volumetric checks and spatial validation.

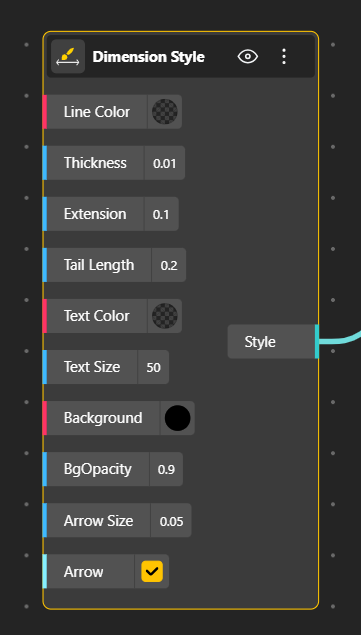
To control the appearance of all dimension graphics, the Dimension Style node generates a reusable style object. This node allows users to define line color and thickness, extension line length, arrow size, arrow tail length, text size, text color, and text background settings. By connecting the style output to one or more dimension nodes, a consistent visual language can be maintained across an entire model.

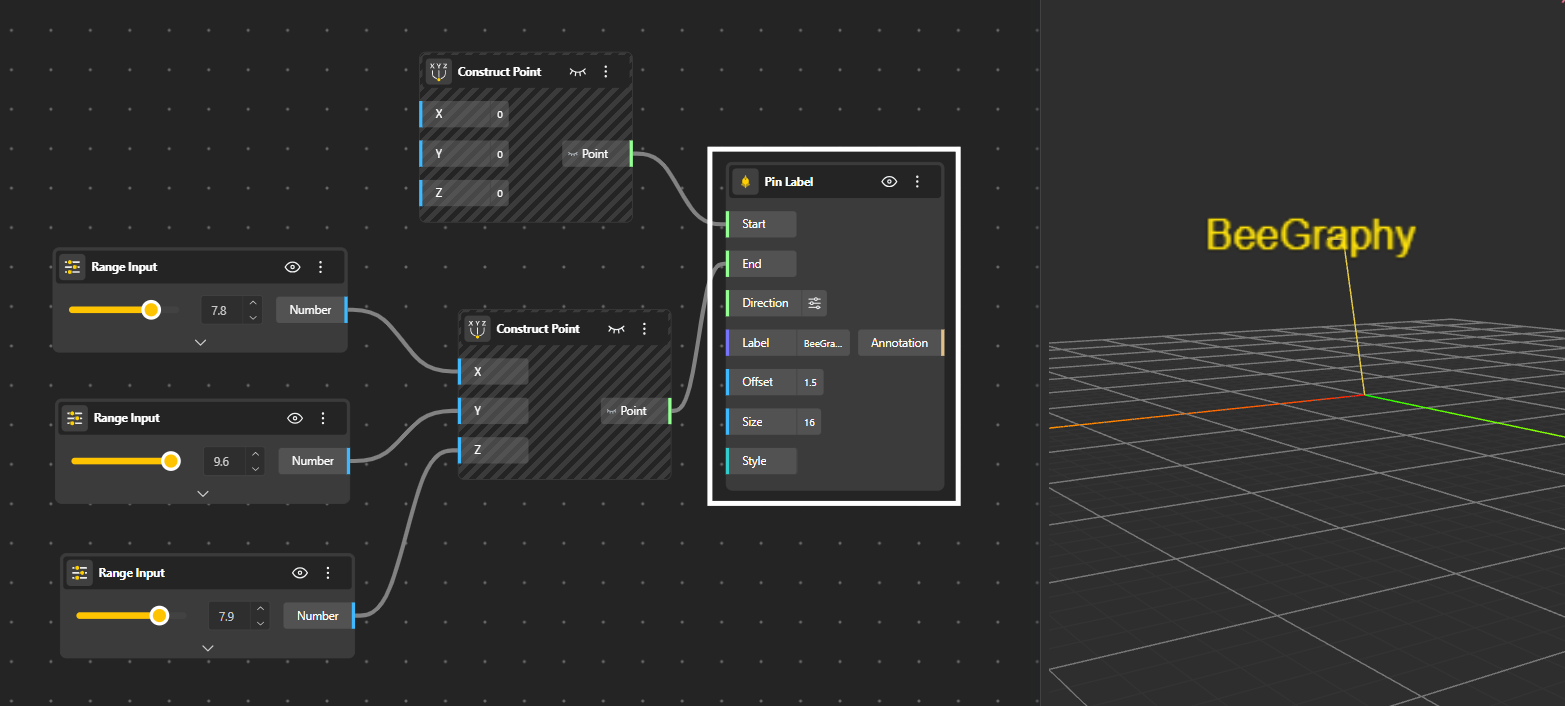
A Pin Label is a dimension-label behavior that keeps the text anchored to a fixed position in the viewport,. This is especially useful in dense models, presentations, or documentation views where labels would otherwise overlap geometry, flip orientation, or drift as the camera changes.