Debug Timing shows the execution time of each node in your graph. This helps you see which nodes are fast and which ones are slowing things down.
Open the Main Menu → Debug Timing
Once enabled, execution times appear directly on nodes in the canvas.
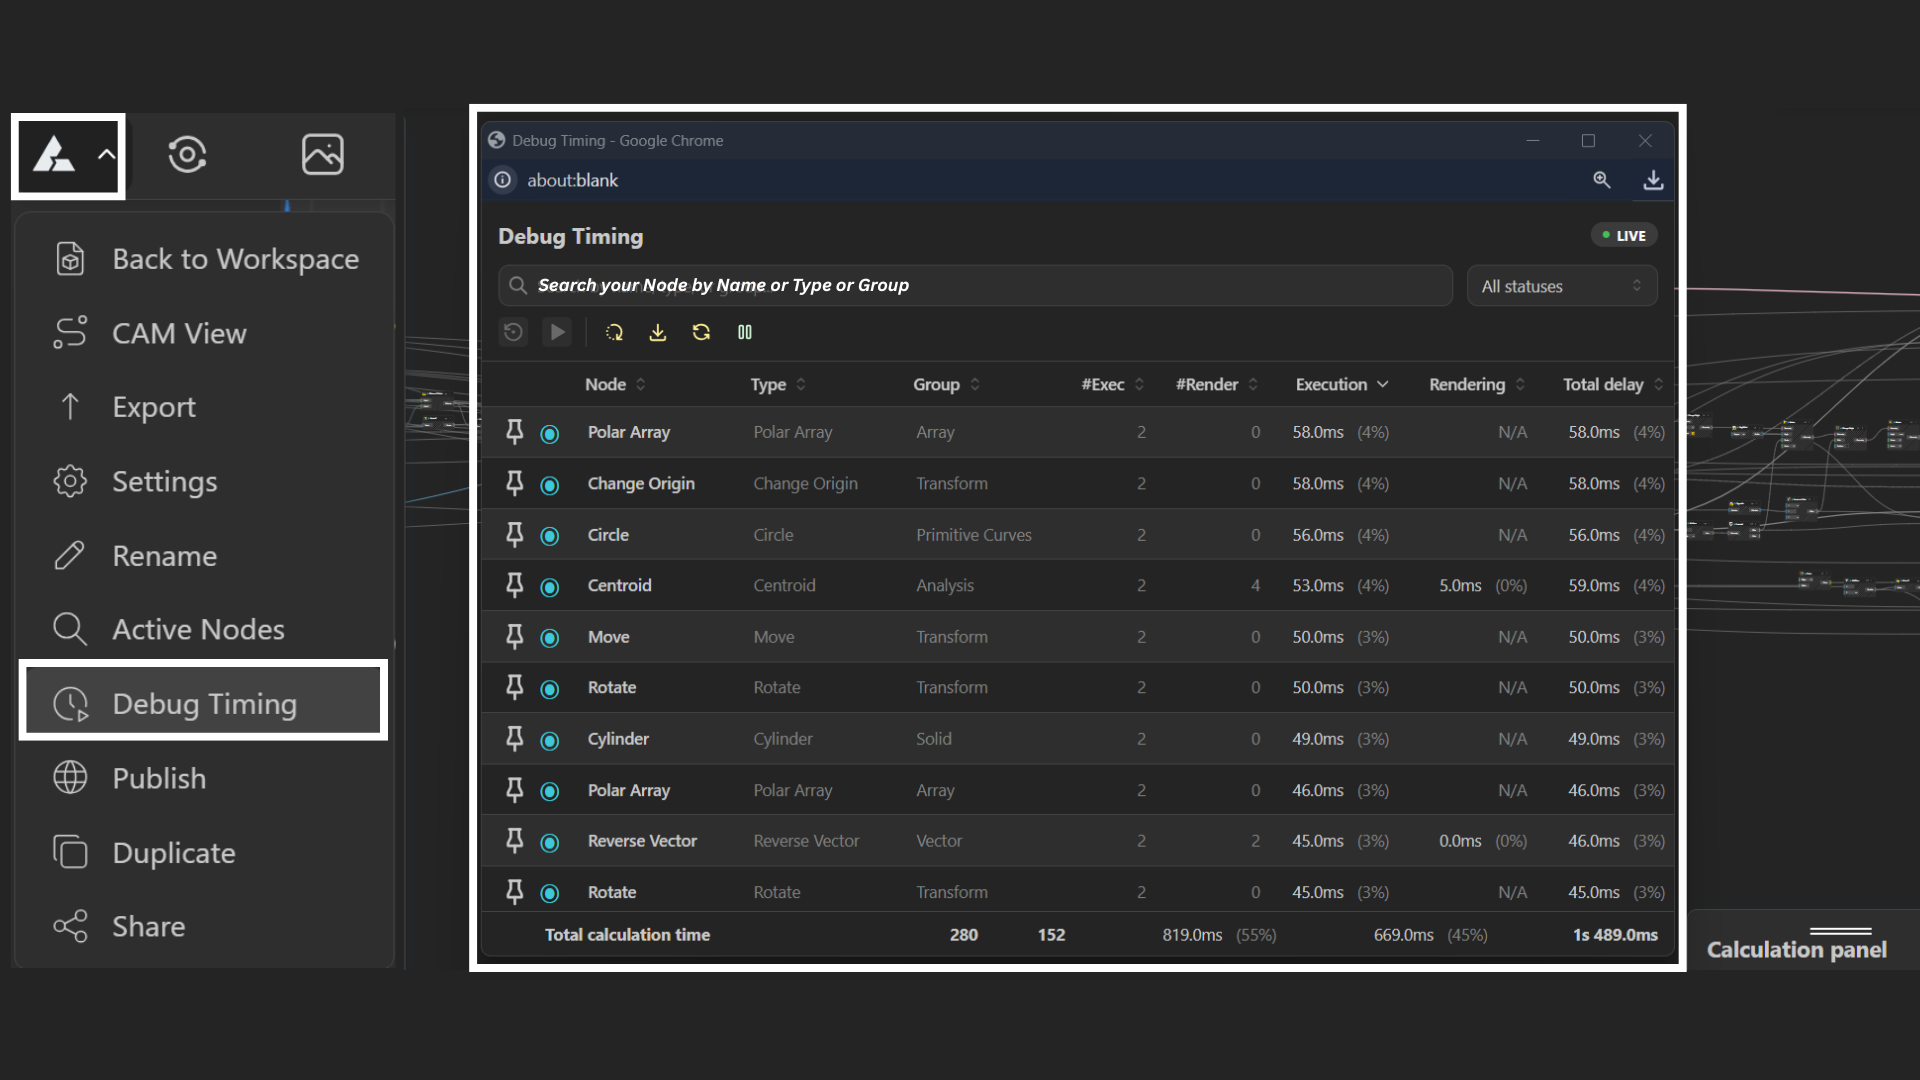
Displays time (in milliseconds) on each node
Updates as your model recalculates
Highlights performance-heavy nodes in your workflow
Use Debug Timing when your model feels slow or unresponsive
Combine with Active Nodes to locate and fix issues faster
Turn it off when not needed to keep the canvas clean