The -core section contains fundamental tools that help you inspect data, manage layers, run scripts, and control conditional logic inside the BeeGraphy editor.
Below is a simple, clear breakdown of each function.
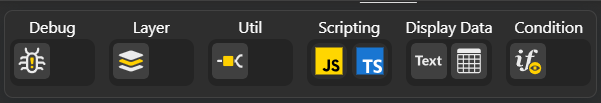
Panel: Shows the output of any node you connect to it. It is as your real-time viewer for what’s happening in your node. Useful for viewing:
Execution lists
Vector points
Distances
Any generated value
Apply Layer: Applies a chosen layer to geometry. Mainly used to:
Organize visual output
Assign objects to specific layers
Control visibility or styling of geometry
Relay: Used to clean up wires in your graph. Helps you reroute connections without changing data. Makes large graphs easier to read and organize.
JavaScripting: Lets you write JavaScript inside your graph. Ideal for custom logic, small algorithms, string manipulations, or math operations.
TypeScripting: Supports TypeScript for more structured scripting. Useful when building reusable logic, cleaner code, or larger functions.
Display Text: Shows text output on the canvas. Great for labeling geometry, showing values, or displaying status messages.
Display Table: Displays a list or structured data in a table format. Perfect for:
Showing processed lists
Showing parameters
Comparing values
Condition Input: Controls logic flow using IF conditions.